Chapter 3 Samples of Writing in R bookdown
In this chapter, you learn how to:
- Reference other sections and equations
- Include in-text citation that links to the bibliography
- Include tables and figures not generated by
Rcode - Include a footnote
As we expand our contributor and reviewer base, it will be helpful to know more about the conventions used in the series regarding the details of R markdown and R bookdown used in the series. This chapter summarizes these conventions.
3.1 Section Labels and Learning Objectives
The following shows how to code Section titles and refer to them.
## Section Labels {#S:SectionLabels}With that reference, one can readily refer to Section 3.1 in your text, as follows:
With that reference, one can readily refer to
Section \@ref(S:SectionLabels) in your text, as follows:
The following shows how to code learning objectives:
***
In this chapter, you learn how to:

- Reference other sections and equations
- Include in-text citation that links to the bibliography
- Include tables and figures
- Include a footnote

***
3.2 Equation References
Here is an example of a latex equation produced in R markdown, with reference number.
You can produce that equation using the following code.
\begin{equation}
  x + y = 1
(\#eq:ExampleEquation)
\end{equation}
With this, equation (3.1) can be referred to using the following code:
With this, equation \@ref(eq:ExampleEquation) can be
referred to using the following code:
3.3 In-text Citations
Here is an example of an in-text citation made possible by R bookdown (Xie 2015). This links to the bibliography where the full referece is displayed. As a convention we use the APA style citation.
Here is an example of an in-text citation made possible by
`R bookdown` [@xie2015]. This links to the bibliography
where the full reference is displayed.
As a convention we use the *APA* style citation.
3.4 Including Tables
In order to include table not generated by R such as a Latex table, we have to make some adjustments to regular Latex syntax.
\[ \begin{matrix} \begin{array}{c|c} \hline \text{Policyholder} & \text{Number of claims} \\\hline \textbf{X} & 1 \\\hline \textbf{Y} & 2 \\\hline \end{array} \end{matrix} \]
Table 2.1 : An example of including tables using Latex in an R markdown document
R markdown does not have a convention for referencing non-R generated tables. For now, we reference them manually as in refer to Table 2.1. We do this by manually inserting an html anchor tag.
The following code produces this table.
<a id=tab:2.1></a>

[Table 2.1]: \#tab:2.1

$$
\begin{matrix}
    \begin{array}{c|c} \hline
    \text{Policyholder} & \text{Number of claims} \\\hline
    \textbf{X} & 1 \\\hline
    \textbf{Y} & 2 \\\hline
    \end{array}
\end{matrix}
$$

[Table 2.1] : An example of including tables using Latex in an `R markdown` document
For reference, then use
`R markdown` does not have a convention for referencing
non-R generated tables. For now, we reference them manually
as in refer to [Table 2.1].
3.5 Including Figures
3.5.1 Figures Generated by R
Most figures are generated using R. Here is an illustrative figure.
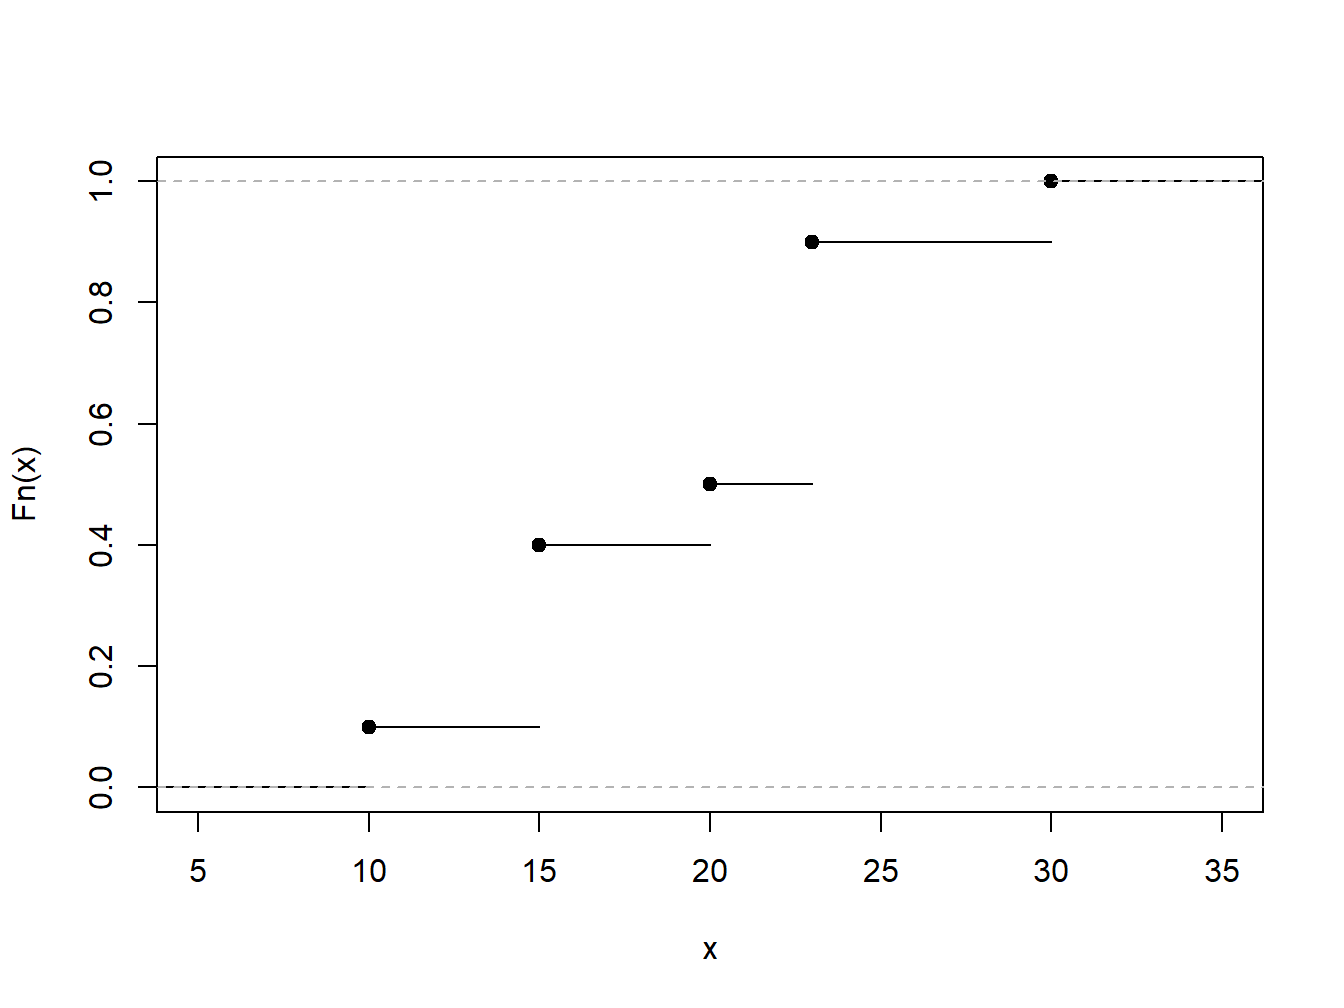
Figure 3.1: Empirical Distribution Function of a Toy Example
that we refer to as Figure 3.1. Here is the code for producing the figure:
```{r EDFToy, echo = FALSE,
   fig.cap = 'Empirical Distribution Function of a Toy Example',
   out.width = '60%', fig.asp = 0.75, fig.align = 'center'}
xExample <- c(10,rep(15,3),20,rep(23,4),30)
PercentilesxExample <- ecdf(xExample)
plot(PercentilesxExample, main = "", xlab = "x")
```
Here is is the code for referencing the Figure 3.1:
Here is is the code for referencing the Figure \@ref(fig:EDFToy):
3.5.2 Figures Not Generated by R
For figures, we store the figures as png or jpeg files in a separate folder called “Figures”. Then we use R code to call those figures for display so that we can reference them.
Here is such a figure:

Figure 3.2: An example of including figures in an R Markdown document
And here is the code that generates the figure:
"three backticks"{r, ExampleFigure, fig.cap = 'An example
of including figures in an R Markdown document',
out.width = '5%', fig.align = 'center', echo = FALSE}
knitr::include_graphics("Figures/RStudio-Ball.png")
"three backticks"
Here is is the code for referencing the Figure 3.2:
Here is is the code for referencing the Figure \@ref(fig:ExampleFigure):
3.6 Including Footnotes
Try to minimize the use of footnotes. But, if you need them, here is how you can include a footnote.2
Here is how you can include a footnote [^1].

[^1]: the footnote displays at the end of the chapter
3.7 Useful Links
Naturally, you will want to learn more about coding in R markdown, R bookdown and so forth. The following provide some useful links for taking the next step.
For an
R markdownguide refer https://rmarkdown.rstudio.com/authoring_pandoc_markdown.html.For a
R bookdownguide, see https://bookdown.org/yihui/bookdown/.For best practices in coding
R, we suggest http://r-pkgs.had.co.nz/style.html.See also our online actuarial text resources at https://sites.google.com/a/wisc.edu/loss-data-analytics/online-actuarial-text-resources.
the footnote displays at the end of the chapter↩